
Abstract:
The Gini Coefficient is the single greatest known predictor of violent crime. Understanding the Gini Coefficient can help us understand murder rates better than analyzing gun ownership rates, gun laws, or any other commonly debated variable.
Background:
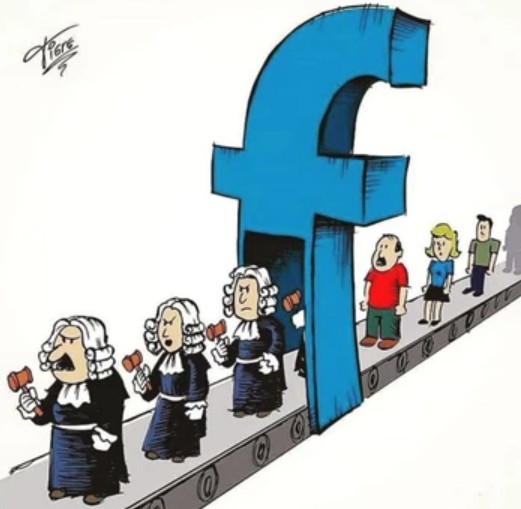
If you are a gun owner and you occasionally peruse social media, you have no doubt encountered the dreaded “gun debate”. That is, when someone attempts to diagnose why evil people do evil things, and it ultimately comes down to a claim that the gun itself is responsible, or that a law change could have avoided a recent tragedy. When the gun debate occurs on social media something truly magical happens. All participants immediately become lawyers, philosophers, psychologists, economists and historians. This phenomenon is illustrated well below.
Of course, debate is a good thing. It helps us formulate our own belief systems and test our beliefs in the marketplace of ideas. Informed debate is better than uninformed debate, however, and it is with that end in mind that all gun owners should be familiar with the Gini Coefficient.
Simply put, the Gini Coefficient provides the single greatest explanation for why murder occurs. It is not the only factor to consider, but it is by far the largest factor. If the gun debate were an African savanna, the Gini Coefficient would be a lumbering elephant while the rest of the factors (gun ownership rates, gun laws, etc.) would be gazelle.
First developed by Italian sociologist Corrado Gini in 1912, its basic pronouncement is that the greater the income inequality in a given area (city, state, country) the higher the murder rate will be. A Gini Coefficient is a number that represents how much inequality of income distribution exists in a given area. You can calculate a Gini Coefficient for a street, a city, a state or a country.
The Guardian notes how well the Gini Coefficient can be used to predict murder rates as follows:
The connection is so strong that, according to the World Bank, a simple measure of inequality predicts about half of the variance in murder rates between American states and between countries around the world. When inequality is high and strips large numbers of men of the usual markers of status – like a good job and the ability to support a family – matters of respect and disrespect loom disproportionately. Inequality predicts homicide rates “better than any other variable”, says Martin Daly, professor emeritus of psychology and neuroscience at McMaster University.
A study conducted by Harvard came to an even more pronounced conclusion, noting “[i]ncome inequality alone explained 74% of the variance in murder rates and half of the aggravated assaults.”
It is important to note that the Gini Coefficient does not say that poverty causes crime. It says that significant (visible) differences between the economic status of neighbors causes crime. In other words, the relative poverty is what matters, not the poverty itself. When everyone is the same level of poor, or everyone is the same level of rich, communities exist in general peace and harmony. Renowned psychologist Jordan Peterson described this phenomenon as follows:
“You always hear this idea that poverty causes crime…but it’s wrong. It’s seriously wrong…There’s no argument about this, it’s already been established. What causes crime, especially aggressive crime, is relative poverty. Relative poverty is not the same thing as poverty at all…Poverty is when you don’t have enough to eat, relative poverty is when the guy next door has a better car than you…What’s really interesting about the Gini Coefficient is that if you go to places where everyone, roughly speaking, is poor…there’s almost no crime. And if you go to places where everyone is rich, there’s almost no crime. If you go places where there are poor people, and moderately well off people, and rich people, and the distribution is really steep, then the rate of aggressive behavior among young men… begins to spiral out of control.” (transcribed from this lecture)
This concept should not be hard to understand, as we all experience it in our daily lives. Imagine you have $500 in your wallet. Would you be more concerned about opening your wallet at New York’s prestigious Medowbrook Polo Club, or while riding New York’s redline subway? Why? Even though there are several variables at play, the obvious answer is there are probably less people at the Polo Club who are willing to hurt you to get your $500. But think about it on a deeper level. What if you only had $1 in your wallet, then would you be as concerned with opening it on the subway? Why? Well, you can safely assume that someone is less likely to harm you to get $1 than they are to get $500. Notice, however, that it is not the amount in question that determines the danger, but instead the relative poverty level of those around you that makes the difference. In other words, the sharper the increase in relative poverty (between you and the potential subway criminal) the greater the probability of crime. The point is someone’s relative poverty, or how their economic status relates to those around them, is more likely to trigger them to violence than any other indicator. The sharper the contrast in relative poverty becomes, the greater the risk of violence. You wouldn’t rob someone if they drove through your neighborhood with $50 in their vehicle, but what if the same vehicle had fifty thousand? Fifty million? Billion? Clearly you aren’t robbing anyone, but you can at least admit you had a slight mental debate as the amount grew larger. Movie plots like Ocean’s 11 tell that story well.
Anyone who has lived, or visited, areas of significant poverty should be able to provide at least anecdotal evidence of how relative poverty interplays with violence. I lived for multiple years in the poorest region of Brazil, the state of Amazonas, where by any definition everyone is poor. I have also spent a fair amount of time in countries like South Africa and Jamaica, where there is a sharp (visible) disparity between the relative poverty of members of almost all communities. On the other end of the spectrum I have spent time in Dubai, where poverty either does not exist or is carefully hidden. In Brazil, researchers have concluded for decades that violent crime manifests itself at significantly higher rates in areas where relative poverty (visible income inequality) is most pronounced (like Rio de Janeiro), than in areas where overall poverty is more pronounced (like the state of Amazonas). Dubai ranks 9th out of 288 cities worldwide for low violent crime rates, with it’s UAE neighbor Abu Dhabi ranking number 1.
On the other hand, South Africa, which has the second highest Gini Index score and where income inequality is very pronounced, ranks 10th worldwide for murder rates per capita (34/100,000). On a recent 2 week trip to South Africa I observed a perfect example of how people are very much aware of the Gini Coefficient risks. A good friend of mine had recently purchased a large amount of land (in excess of 50,000 acres) in South Africa’s Eastern Cape and started a business in a very poor community. Aware that there is a real threat in doing so, he immediately went into the community and hired as many people as he could, paying them double or triple what they were currently making. He also built a school in the community and began offering a wide array of free services. His intent in doing so, aside from being a good person, was to mitigate the very real risk he would become a victim of the alarming amount of violent murders that have been occurring on South African farms. It was an example of the Gini Coefficient theory in action, even if nobody knew it.
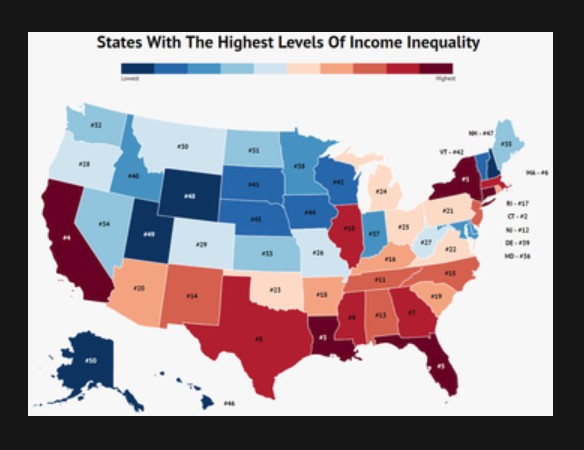
Again, the Gini Coefficient is only one factor (albeit a large factor) in analyzing why violent crime occurs. There are many variables that will affect murder rates and we should be cautious to draw direct correlations based solely on single variables. However, even without diving deep into the data one can begin to grasp the correlation simply by looking at a map of where income inequality is highest and then comparing that to states/cities with the highest murder rates. This correlation has been confirmed by regression analysis studies.
States with the most murders (gross):
1: California (#4 income inequality ranking)
2: Texas (#8 income inequality ranking)
3: Florida (#5 income inequality ranking)
4: Illinois (#10 income inequality ranking)
5: Pennsylvania (#21 income inequality ranking)
6: Georgia (#7 income inequality ranking)
7: New York (#1 income inequality ranking)
8: Michigan (#24 income inequality ranking)
9: North Carolina (#15 income inequality ranking)
10: Maryland (#36 income inequality ranking)
So What Does This Tell Us?
A couple things. First, as a gun owner we are taught to always be in a state of awareness. Colonel Jeff Cooper is credited with developing the below situational color code chart, which associates levels of awareness to specific colors.
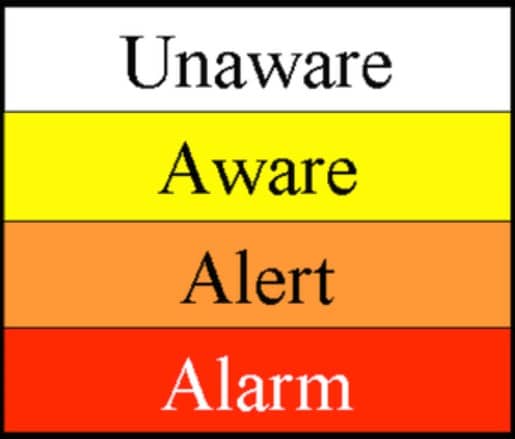
In condition yellow you are relaxed but constantly aware of who and what is around you. In condition yellow you will pay attention to things like how you act or dress in certain social situations, how carelessly you advertise your relative wealth, or even where you decide to purchase your home. It is not a condition of paranoia, but instead a state of constant passive awareness. In this context, understanding the Gini Coefficient can have a profound effect on how you conduct yourself, which can in turn have a profound effect on what dangers you encounter. Don’t want to encounter violent crime? Don’t advertise your wealth (intentionally or unconsciously) among people of a significantly sharper relative poverty level.
Surprisingly, however, research shows that the Gini Coefficient does not only predict the type of violent crime you might anticipate (robbery, burglary, etc.) but also has been proven to predict more expressive forms of homicide (such as mass shootings).
Rates of economically motivated homicide such as robbery-murders could be more directly linked to income inequality than rates of other, more expressive types of homicide, with economically motivated homicides being an extreme response to unequal distributions of money and material goods (Bailey, 1984; Kovandzic et al., 1998; R. N. Parker, 1989).
However, there are also arguments that income inequality has as strong or stronger an association with rates of non-economic homicide. Resentment and hostility flowing from relative deprivation could be channeled into expressive violence against readily available targets such as intimates, family, and friends (Danziger & Wheeler, 1975; Messner & Tardiff, 1986).
Second, understanding the Gini Coefficient can help guide our public policy discussions. No, I am absolutely not advocating any governmental equality of income practices. However, understanding that humans are prone to commit certain crimes when certain economic conditions exist could potentially alter the dialogue from “what gun laws can we pass to stop this from happening again,” to a much more productive discussion about how to stop violent crime en masse amongst socioeconomic communities. You want the most effective way to stop violent crime in your neighborhood? Help everyone around you get rich (or much less ideally make yourself as poor as everyone around you).
Finally, if nothing else, understanding the Gini Coefficient should tell us that there are more complex powers at play affecting murder rates than many politicians would want us to believe. There are no conceivable laws regulating firearms that can address the larger issue addressed in this article. When a politician (or social media crusader) attempts to minimize the extremely complex issue of why evil people do evil things to something that can be solved through a single law change, one is right to be skeptical of their motivations.
That’s what the Gini Coefficient tells us.
Phil Nelsen is a nationally recognized firearms law attorney, expert witness, college professor, author and co-founder of Legal Heat, the nation’s largest firearms training firm.
Legal Heat offers CCW classes nationwide, and also publishes the industry leading Legal Heat 50 State Guide to Firearm Laws and Regulations which can be downloaded on iTunes, GooglePlay and Kindle App stores. You can purchase the paperback version of the Legal Heat 50 State Guide or sign up for a class at https://mylegalheat.com